|
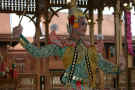
The People
of Bhutan
The
official estimate of Bhutan's population in 1990 was about
600,000 but other sources estimate the population for 2000
was just under 2 million. Those living in Bhutan of
Nepali origin have been excluded from the official census
since 1990 which results in such a large discrepancy in
population numbers.
Bhutan
has four major ethic groups: Bhutia, Sharchops, Nepali,
and other indigenous groups. The Bhutia, who are
descended from Tibetans, live in the central and northern
regions of Bhutan. This ethnic group basically
dominates politics in Bhutan particularly with it's
contribution of government officials and monks that come
from it.
Believed
to be Bhutan's earliest settlers, the Sharchops live in
the southeastern and eastern region. They speak both
Tibeto-Burman languages as well as Hindi.
The
Nepali people are the latest immigrants to Bhutan.
Living in the southwestern and south central section of
Bhutan, immigration of Nepali's has been forbidden by the
Bhutanese government since 1959. Fear of Bhutan
becoming too heavily populated with Nepalis brought about
this and the ban on living in the central Himalayan
region. Bhutan traditions and culture are to
be retained and not dilute Bhutanese distinctiveness.
There
are small groups of ethnic minorities that live all
throughout Bhutan with the largest group living in the
Duars. This group is related to those groups living
in India's Assam and Bangla states.
|
Population:
|
|
699,847
country
comparison to the world:
164
note:
the
Factbook population estimate is consistent with
the first modern census of Bhutan, conducted in
2005; previous Factbook population estimates for
this country, which were on the order of three
times the total population reported here, were
based on Bhutanese government publications that
did not include the census (July 2010 est.)
|
|
|
Age
structure:
|
|
0-14 years: 30.2%
(male 106,410/female 102,164)
15-64 years: 64.3%
(male 235,988/female 208,484)
65 years and
over: 5.5%
(male 20,169/female 17,926) (2010 est.)
|
|
|
Median
age:
|
|
total: 24.3
years
male: 25
years
female: 23.7
years (2010 est.)
|
|
|
Population
growth rate:
|
|
1.236% (2010
est.)
country
comparison to the world:
101 |
|
|
Birth
rate:
|
|
19.62
births/1,000 population (2010 est.)
country
comparison to the world:
95 |
|
|
Death
rate:
|
|
7.25
deaths/1,000 population (July 2010 est.)
country
comparison to the world:
124 |
|
|
Net
migration rate:
|
|
0 migrant(s)/1,000
population
country
comparison to the world:
88 |
|
|
Urbanization:
|
|
urban
population: 35%
of total population (2008)
rate of
urbanization: 4.9%
annual rate of change (2005-10 est.)
|
|
|
Sex
ratio:
|
|
at birth: 1.05
male(s)/female
under 15 years:
1.04
male(s)/female
15-64 years: 1.13
male(s)/female
65 years and
over: 1.12
male(s)/female
total
population: 1.1
male(s)/female (2010 est.)
|
|
|
Infant
mortality rate:
|
|
total: 46.92
deaths/1,000 live births
country
comparison to the world:
55
male: 47.8
deaths/1,000 live births
female: 45.99
deaths/1,000 live births (2010 est.)
|
|
|
Life
expectancy at birth:
|
|
total
population: 66.71
years
country
comparison to the world:
158
male: 65.89
years
female: 67.57
years (2010 est.)
|
|
|
Total
fertility rate:
|
|
2.29 children
born/woman (2010 est.)
country
comparison to the world:
105 |
|
|
HIV/AIDS
- adult prevalence rate:
|
|
less than 0.1%
(2007 est.)
country
comparison to the world:
113 |
|
|
HIV/AIDS
- people living with HIV/AIDS:
|
|
fewer than 100
(2007 est.)
country
comparison to the world:
162 |
|
|
HIV/AIDS
- deaths:
|
|
NA
|
|
|
Major
infectious diseases:
|
|
degree of risk:
intermediate
food or
waterborne diseases: bacterial
and protozoal diarrhea, hepatitis A, and typhoid
fever
vectorborne
diseases: dengue
fever and malaria
water contact
disease: leptospirosis
(2009)
|
|
|
Nationality:
|
|
noun: Bhutanese
(singular and plural)
adjective: Bhutanese
|
|
|
Ethnic
groups:
|
|
Bhote 50%,
ethnic Nepalese 35% (includes Lhotsampas - one of
several Nepalese ethnic groups), indigenous or
migrant tribes 15%
|
|
|
Religions:
|
|
Lamaistic
Buddhist 75%, Indian- and Nepalese-influenced
Hinduism 25%
|
|
|
Languages:
|
|
Dzongkha
(official), Bhotes speak various Tibetan dialects,
Nepalese speak various Nepalese dialects
|
|
|
Literacy:
|
|
definition: age
15 and over can read and write
total
population: 47%
male: 60%
female: 34%
(2003 est.)
|
|
|
School life
expectancy (primary to tertiary education):
|
|
total: 11
years
male: 12
years
female: 11
years (2008)
|
|
|
Education
expenditures:
|
|
5.1% of GDP
(2008)
country
comparison to the world:
63
|
|